|
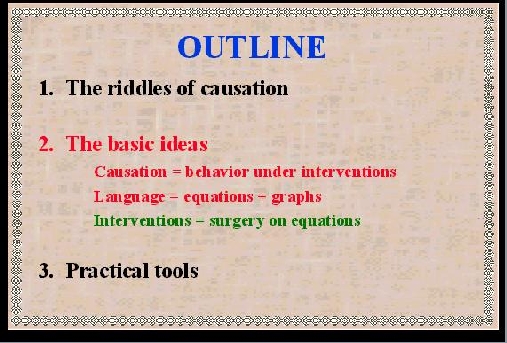
SLIDE 40: OUTLINE - PART 2
This brings us to the second part of the lecture: how
the second riddle of causation can be solved by
combining equations with graphs, and how this
solution makes the first riddle less formidable.
The overriding ideas in this solution are:
FIRST: treating causation as a summary of behavior
under interventions and
SECOND: using equations and graphs as a mathematical
language within which causal thoughts can be represented and
manipulated.
And to put the two together, we need a THIRD concept:
Treating interventions a s a surgery over equations.
Let us start with an area that uses causation extensively
and never had any trouble with it: Engineering.
|
|
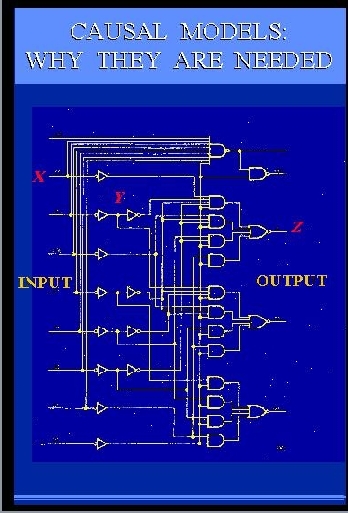
SLIDE 41: CIRCUIT DIAGRAM
Here is an engineering drawing of a circuit diagram that
shows cause-effect relations
among the signals in the circuit.
The circuit consists of AND gates and OR gates,
each performing some logical function between
input and output.
Let us examine this diagram closely,
since its simplicity and familiarity are very deceiving.
This diagram is, in fact, one of the greatest marvels of science.
It is capable of conveying more information than
millions of algebraic equations
or probability functions or logical expressions".
What makes this diagram so much more powerful
is the ability to predict
not merely how the circuit behaves
under normal conditions, but also
how the circuit will behave under millions
of ABNORMAL conditions.
For example, given this circuit diagram, we can
easily tell
what the output will be if some input changes from 0 to 1.
This is normal and can easily be expressed by a
simple input-output equation.
Now comes the abnormal part.
We can also tell
what the output will be when we set Y to 0 (zero), or tie it to X, or
change this AND gate
to an OR gate,
or when we perform any of the millions combinations of
these operations.
|
The designer of this circuit did not
anticipate or even consider such weird interventions, yet,
miraculously, we can predict their consequences. How?
Where does this representational power come
from?
It comes from what
early economists called AUTONOMY, namely, the gates
in these diagram represent
independent mechanisms - it is easy to change one without changing the other.
The diagram takes advantage
of this independence and describes
the normal functioning of the circuit
USING PRECISELY THOSE BUILDING BLOCKS THAT WILL
REMAIN UNALTERED UNDER INTERVENTION.
My colleagues from Boelter Hall are surely wondering why
I stand here before you blathering about an engineering
triviality as if it were the 8th wonder of the world.
I have three reasons for doing this.
First, I will try to show that there is a lot of unexploited
wisdom in practices that engineers take for granted.
|
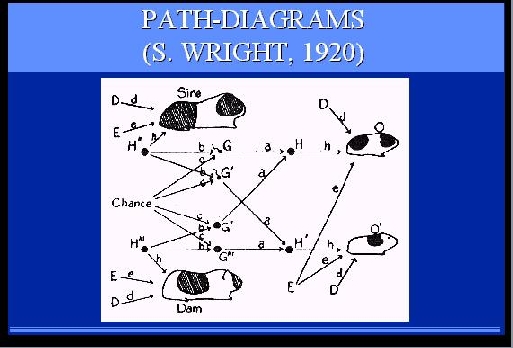
SLIDE 42: PATH DIAGRAMS
Second, I am trying to remind economists and social scientists
of the benefits of this diagrammatic method.
They have been using a similar method on and off for over 75 years,
called structural equations modeling and path-diagrams, but in recent years
have allowed algebraic convenience to suppress
the diagrammatic representation, together with its benefits.
Finally, these diagrams capture in my opinion, the very
essence of causation - the ability to predict the consequences of abnormal
eventualities and new manipulations.
In this diagram, for example, it is possible to predict what
coat pattern the litter guinea-pig is likely to have, if we change
environmental factors, shown here by as input (E) in green, or even
genetic factors, shown in red as intermediate nodes between parents
|
and offsprings (H).
Such predictions cannot be made on the basis
of algebraic or correlational analysis.
Viewing causality this way explains
why scientists pursue causal explanations with
such zeal, and
why attaining a causal model is
accompanied with a sense of gaining "deep understanding" and
"being in control."
|
SLIDE 43: DUCK MACHINE
DEEP UNDERSTANDING means
knowing, not merely how things behaved
yesterday, but also how things will behave under new
hypothetical circumstances, control being one such circumstance.
Interestingly, when we have such understanding we feel "in control"
even when if we have no practical way of controlling things.
For example, we have no practical way to control
celestial motion, and still the theory
of gravitation gives us a feeling of understanding
and control, because it provides a blueprint for hypothetical control.
We can predict the effect on
tidal waves of unexpected new events, say, the moon being
hit by a meteor or the gravitational constant suddenly
diminishing by a factor of 2 and, just as important, the
gravitational theory
gives us the assurance that ordinary manipulation
|
of earthly things will NOT control tidal waves.
It is not surprising that causal
models are viewed as the litmus test distinguishing
deliberate reasoning from reactive or instinctive response.
Birds and monkeys may possibly be trained
to perform complex tasks such as fixing a broken wire, but that
requires trial-and-error training.
Deliberate reasoners, on the other hand, can anticipate
the consequences of new manipulations WITHOUT EVER TRYING
those manipulations.
|
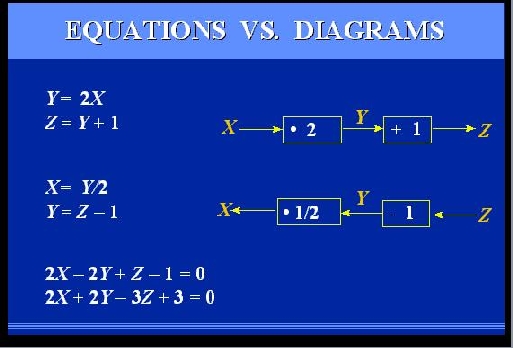
SLIDE 44: EQUATIONS VS. DIAGRAMS
Let us magnify a portion of the circuit diagram so that we
can understand
why the diagram can predict outcomes that equations can not.
Let us also switch from logical gates to linear equations
(to make everyone here more comfortable), and assume we
are dealing with a system containing just two components: a multiplier
and an adder.
The MULTIPLIER
takes the input and multiplies it by
a factor of 2; the ADDER takes its input and adds a 1 to it.
The equations describing these two components
are given here on the left.
But are these equations EQUIVALENT to the diagram
on the right?
Obviously not!
If they were, then let us switch the variables
around, and the resulting two
equations should be equivalent to the circuit shown
below.
But these two circuits are different.
|
The top one tells us that if we physically manipulate Y it will
affect Z, while the bottom one shows that manipulating Y will affect X
and will have no effect on Z.
Moreover, performing some additional algebraic operations
on our equations, we can obtain two new equations, shown
at the bottom, which point to no structure AT ALL;
they simply represent two constraints on
three variables, without telling us how they influence
each other.
Let us examine more closely the mental process by which we
determine the effect of physically manipulating Y, say setting Y to 0.
|
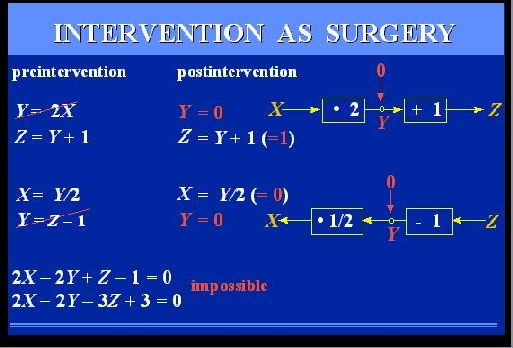
SLIDE 45: INTERVENTION AS SURGERY ON MECHANISM
Clearly, when we set Y to 0,
the relation between X and Y is no
longer given by the multiplier - a new
mechanism now controls Y, in which
X has no say.
In the equational representation, this amounts to
replacing the equation Y=2X by a new equation, Y=0,
and solving a new set of equations, which gives
Z = 1.
If we perform this surgery on the lower pair of equations,
representing to the lower model, we get
of course a different solution. The second equation will
need to be replaced, which will yield X = 0 and leave
Z unconstrained.
We now see how this model of intervention leads to
a formal definition of causation:
"Y is a cause of Z if we can change Z by manipulating Y, namely, if
after surgically removing the equation for Y, the solution for
Z will depend on the new value we
|
substitute for Y".
We also see how vital the diagram is in this
process.
THE DIAGRAM TELLS US WHICH EQUATION
IS TO BE DELETED WHEN WE MANIPULATE Y.
That information is totally washed out when we transform the
equations into algebraically equivalent form, as shown
at the bottom of the screen -
from this pair equations alone, it is impossible to
predict the result of setting Y to 0, because we do not
know what surgery to perform - there is no
such thing as "the equation for Y".
IN SUMMARY, INTERVENTION AMOUNTS TO A
SURGERY ON EQUATIONS, GUIDED BY A DIAGRAM, AND CAUSATION
MEANS PREDICTING THE CONSEQUENCES OF SUCH A SURGERY.
This is a universal theme that
goes beyond physical systems.
In fact, the idea of modeling interventions by "wiping out" equations
was first proposed by an ECONOMIST,
Herman Wold in 1960, but his teachings have all but disappeared
from the economics literature.
History books attribute this mysterious disappearance
to Wold's personality, but I tend to believe that the
reason goes deeper:
Early econometricians were very careful mathematicians; they
fought hard to keep their
algebra clean and formal, and could not agree to have it
contaminated by gimmicks such as diagrams.
And as we see on the screen
the surgery operation makes no mathematical sense without
the diagram, as it is sensitive to the way we write the equations.
Before expounding on the properties of this new
mathematical operation, let me demonstrate how
useful it is for clarifying concepts in statistics and economics.
|
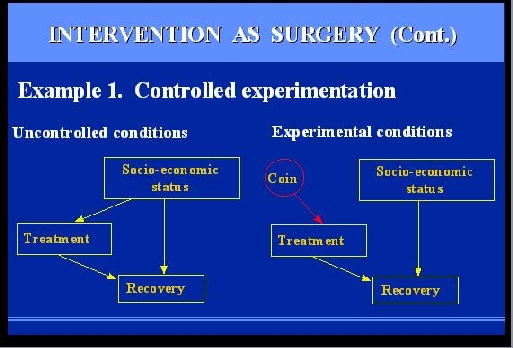
SLIDE 46: INTERVENTION AS SURGERY - CONTROLLED EXPERIMENTS
Why do we prefer controlled experiment over uncontrolled studies?
Assume we wish to study the effect of some drug
treatment on recovery of patients suffering from a given disorder.
The mechanism governing the behavior of each patient is
similar in structure to the circuit diagram we saw earlier:
Recovery is a function of both the treatment and other
factors, such as socio-economic conditions, life-style,
diet, age etc. only one such factor is shown here.
Under uncontrolled conditions, the choice of treatment is up to the
patients, and may depend on the patients socio-economic
background.
This creates a problem, because we can't tell if changes in
recovery rates are due to treatment or to those background factors.
What we wish to do is compare patients of same backgrounds
and that is precisely what
Fisher's RANDOMIZED EXPERIMENT accomplishes.
How?
|
It actually consists of two parts, randomization
and INTERVENTION.
Intervention means that we change the natural behavior
of the individual: we separate subjects into two groups,
called treatment and control, and we convince the subjects to
obey the experimental policy.
We assign treatment to some patients who, under normal
circumstances, will not seek treatment, and we give placebo to patients
who otherwise would receive treatment.
That, in our new vocabulary, means SURGERY - we
are severing one functional link and replacing it by another.
Fisher's great insight was that connecting
the new link to a random coin flip, GUARANTEES
that the link we wish to break, is actually broken.
The reason is, that a random
coin is assumed unaffected by anything we can
measure on a macroscopic level, including, of course,
a patient socio-economic background.
This picture provides a meaningful and formal
rationale for the universally accepted procedure of
randomized trials.
In contrast, our next example uses the
surgery idea to point out inadequacies in widely
accepted procedures.
|
SLIDE 47: EXAMPLE 2 - POLICY ANALYSIS
The example involves a Government official trying to evaluate the
economic consequences of some policy, say taxation.
A deliberate decision to raise or lower taxes is a surgery on the
model of the economy because it modifies the conditions prevailing while the
model was built.
Economic models are built on the basis of data taken over
some period of time, and during this period of time, taxes were lowered and
raised in response to some economic conditions or political pressure.
However, when we EVALUATE
a policy, we wish to compare alternative policies
under the SAME economic conditions, namely we wish
to sever this link that, in the past, has tied policies
to those conditions.
|
In this set-up, it is impossible of course to
connect our policy to a coin and run a controlled
experiment; we do not have the time
for that, and we might ruin the economy before the
experiment is over.
Nevertheless the analysis that
we SHOULD CONDUCT is to infer the behavior of this
mutilated model from data governed by a non-mutilated
model.
I said, SHOULD CONDUCT, because you will not find such analysis in
any economics textbook.
As I mentioned earlier, the surgery idea of
Herman Wold,
was stamped out of the economics literature in the 1970's
and all discussions on policy analysis that I could find, assume that the
mutilated model prevails throughout.
The fact that taxation is under government
control at the time of evaluation is assumed to be
sufficient for treating taxation an exogenous variable
throughout when, in fact, taxation is an endogenous variable
during the model-building phase, and turns exogenous
only when evaluated.
Of course, I am not claiming that reinstating the surgery model
would enable the government to balance its budget overnight,
but it is certainly something worth trying.
Let us examine now how the surgery interpretation resolves Russell's
enigma: concerning the clash between the directionality of
causal relations and the symmetry of physical equations.
The equations of physics are indeed symmetrical,
but when we compare the phrases "A CAUSES B"
vs. "B CAUSES A" we are not talking about a single
set of equations.
Rather, we are comparing two
world models, represented by two different sets of equations;
one in which the equation for A is surgically removed,
the other where the equation for B is removed.
Russell would probably stop us at this point and ask:
"How can you talk about TWO world models,
when in fact there is only one world model, given by all the equations
of physics put together?"
The answer is: YES.
If you wish to include the entire universe in the model,
causality disappears because interventions disappear - the manipulator and the
manipulated loose their distinction.
However, scientists rarely
consider the entirety of the universe as an object of
investigation.
In most cases the scientist carves a
piece from the universe and proclaims that piece: IN namely, the FOCUS
of investigation.
The rest of the universe is then
considered OUT or BACKGROUND, and is summarized by
what we call BOUNDARY CONDITIONS.
This choice of INs and OUTs creates asymmetry in the way we
look at things, and it is this asymmetry that permits us to talk about
"outside intervention", hence, causality and cause-effect directionality.
|
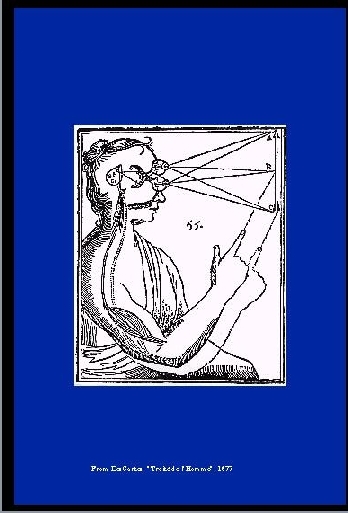
SLIDE 48: HAND-EYE SYSTEM (DESCARTES, L'HOMME)
This can be illustrated quite nicely using Descartes
classical drawing.
As a whole, this hand-eye system knows nothing about
causation.
It is merely
a messy plasma of particles and photons trying their very
best to obey Schroedinger's Equation, which is symmetric.
|
|
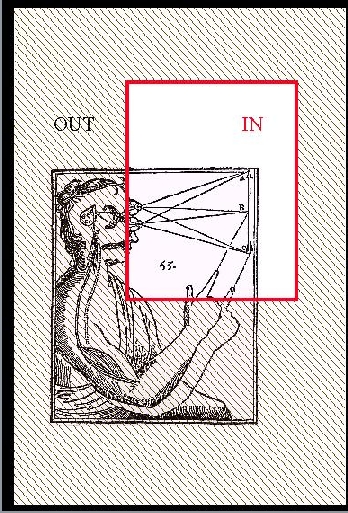
SLIDE 49: HAND-EYE SECTION
However, carve a chunk from it, say the
object part, and we can talk about the motion of
the hand CAUSING this light ray to change angle.
|
|
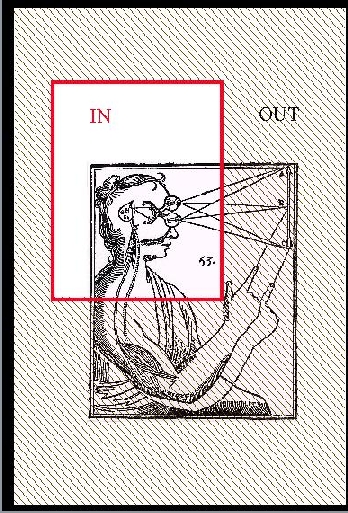
SLIDE 50: EYE-HAND SECTION
Carve it another way, focusing on the
brain part, and, lo and behold, it is now
the light ray that causes the hand to move - precisely the opposite direction.
The lesson is that it is the way we carve up the
universe that determines the directionality
we associate with cause and effect.
Such carving is tacitly assumed in every scientific investigation.
In artificial intelligence it was called circumscription,
by J. McCarthy.
In economics, circumscription amount to deciding which variables
are deemed endogenous and which ones exogenous, IN the
model or EXTERNAL to the model.
|
|
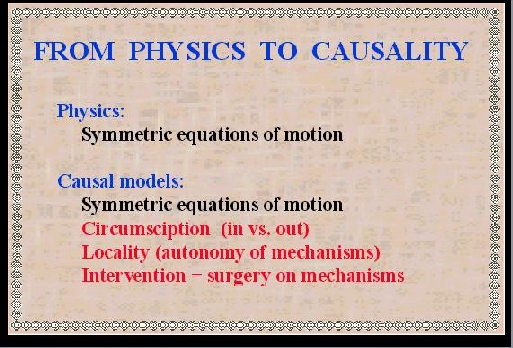
SLIDE 51: FROM PHYSICS TO CAUSALITY
Let us summarize the essential differences
between equational and causal models.
Both use a set of symmetric equations to describe
normal conditions.
The causal model, however,
contains three additional ingredients:
a distinction between the IN and the OUT.
An assumption that each equation corresponds to
an independent mechanism, hence, it must be preserved as a separate mathematical sentence.
Interventions are interpreted as surgeries
over those mechanism.
This brings us closer to realizing the dream of
making causality a friendly part of physics.
But one ingredient is missing: THE ALGEBRA.
We discussed earlier how important the computational
facility of algebra was to scientists and engineers in
the Galilean era.
Can we expect such algebraic facility to serve causality as well?
Let me rephrase it differently:
Scientific activity, as we know it, consists
of two basic components:
|
|
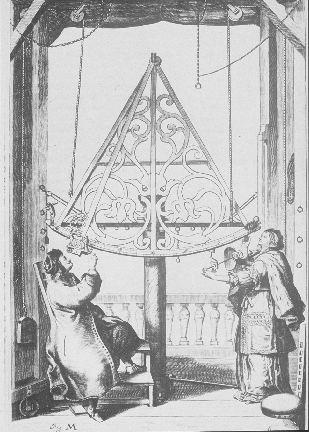
SLIDE 52: OBSERVATORY (HEVELIUS, 1673)
Observations
|
|
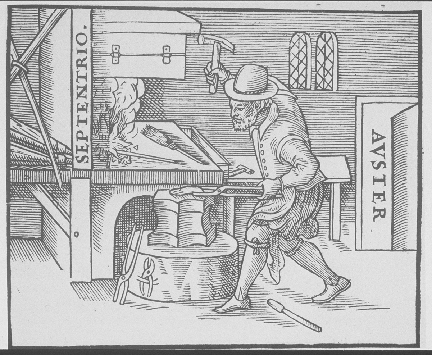
SLIDE 53: HAMMERING A MAGNET (GILBERT, DE MAGNET, 1600)
and interventions.
|
|
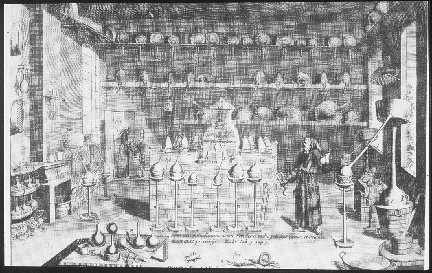
SLIDE 54: LABORATORY
The combination of the two is what we call a LABORATORY,
a place where we control
some of the conditions and observe others.
It so happened that standard algebras
have served the observational component very well,
but, thus far, have not benefited the interventional component.
This is true for the algebra of equations,
Boolean algebra, and probability calculus,
all are geared to serve observational sentences,
but not interventional sentences.
|
|
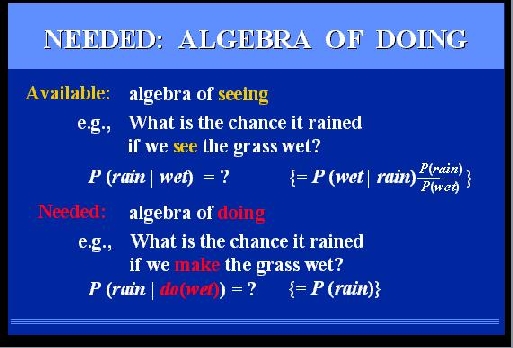
SLIDE 55: NEEDED: ALGEBRA OF DOING (CONT.)
Take for example, probability theory.
If we wish to find the chance it rained, given that we
see the grass wet, we can express our question
in a formal sentence written like that:
P(rain|wet)
to be read: Probability~Of~Rain~given~~Wet.
The vertical bar stands for the phrase: "given that we see".
Not only can we express this question
in a formal sentence but we can also use the machinery of probability
theory and transform the
sentence into other expressions.
In our example, the sentence on the left can be transformed to
the one on the right, if we find it more convenient or informative.
But suppose we ask a different question:
"What is the chance it rained if we MAKE the grass wet?"
We cannot even express our query in the syntax of probability, because the vertical bar is already taken to mean "given that I see".
We can invent a new symbol
|
"DO", and each time we see a DO
after the bar we read it "GIVEN THAT WE DO" - but this does not help
us compute the answer to our question, because the rules of probability
do not apply to this new reading.
We know intuitively what the answer should be:
P(rain), because making the grass wet does not change the chance of rain.
But can this intuitive answer, and others like
it, be derived mechanically?
so as to comfort our thoughts when intuition fails?
The answer is YES, and it takes a new algebra:
First, we assign a symbol to the new operator
"given that I do".
Second, we find
the rules for manipulating sentences containing
this new symbol.
We do that by a process analogous to
the way mathematicians found the rules of
standard algebra.
|
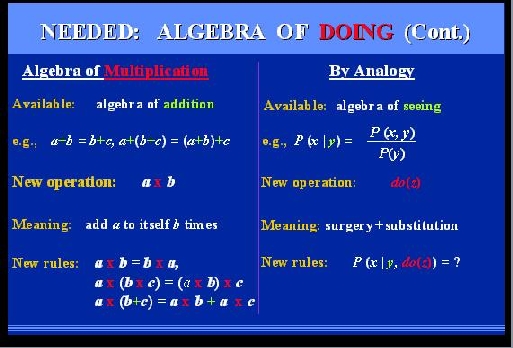
SLIDE 56: NEEDED: ALGEBRA OF DOING
Imagine that you are a mathematician in the 16th
century, you are now an expert in the algebra
of ADDITION, and you feel an urgent need to introduce
a new operator: MULTIPLICATION, because you are tired of
adding a number to itself all day long.
First thing you do is assign the new operator a symbol:
MULTIPLY.
Then you go down to the meaning of the operator,
from which you can deduce its rules of transformations.
For example: the commutative law of multiplication
can be deduced that way, the associative law,
and so on,.... we now learn all this in high school.
In exactly the same fashion, we can deduce the rules
that govern our new symbol: do(x).
We have an algebra for seeing, namely, probability theory.
We have a new operator, with a brand new red outfit and a
very clear meaning, given to us by the surgery procedure.
The door is open for deduction and the
result is give in the next slide.
|
|
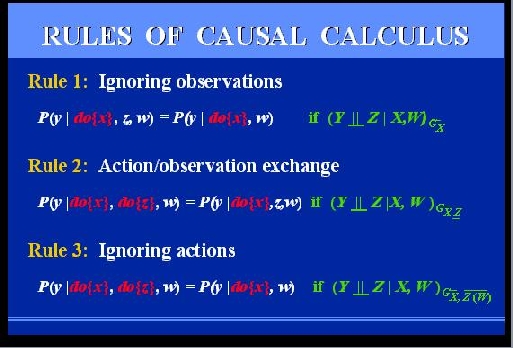
SLIDE 57: CAUSAL CALCULUS
Please do not get alarmed, I do not expect you to
read these equations right now, but I think you can still get the
flavor of this new calculus.
It consist of 3 rules that permit
us to transform expressions involving actions
and observations, into other expressions of this type.
The first allows us to ignore an irrelevant observation, the third
to ignore an irrelevant action,
the second allows us to exchange an action with an
observation of the same fact.
What are those green symbols on the right?
These are the green lights which the diagram gives us,
whenever the transformation is legal.
We will see them in action on our next example.
|
Continue
with Part 3